

In this video we are going to create an expert advisor that is able to calculate the values for the RSI indicator for different time frames, so let’s find out how to do that with mql4.
To get started please click on a little icon here or press F4 on your keyboard, now you should see the Metaeditor window and here you click on file, new file, expert advisor from template, continue, I will call this file simple multiple RSI, click on continue, continue and finish.
Now you can delete everything above the ontick function and let’s also remove the two comment lines here.
We start by creating a variable for the signal, this is a string variable called signal but we don’t assign any values here because we are going to calculate that later.
Calculating the current RSI value that is done by using the included iRSI function that comes with mql4, we do it for the current symbol on the chart and the currently selected period on that chart, we want to calculate the value for fourteen candles based on the close price and we don’t want to shift the indicator here, shifting means that we could use another value that is relative to the current bar, zero means that we calculate the value for the current one and now we also want to see the values for the thirty-minute time frame and the sixty-minute time frame. You could change the view for the different time frames here and to do that we simply need to exchange one value here and that’s the one for the period. For thirty minutes I use period underscore m thirty, if you mark that and press F1 you will see that we have all these time frames available here this one is for thirty minutes and the period underscore h one value is for sixty minutes, so let’s add this one and of course you need to change the names of the variables here but now we have three values, the one for the current time frame, the one for thirty minutes and the one for sixty minutes and if all those time frames show an RSI value that is above seventy – that would be the case when the signal line is above the upper dotted line here – that is what we would consider to be a sell signal so now we assign the word sell to our signal.
In the other case if all the RSI values for the different time frames are below thirty that would be a buy signal and in that case, we would assign the word buy to our signal and if our signal equals buy and the return value for orders total equals zero – that would mean we have a buy signal and no open orders –and in that case we use order send for the current symbol and buy ten micro lot.
Otherwise, if the signal equals sell and we have no open orders we would use order send for the current symbol and sell ten micro lot.
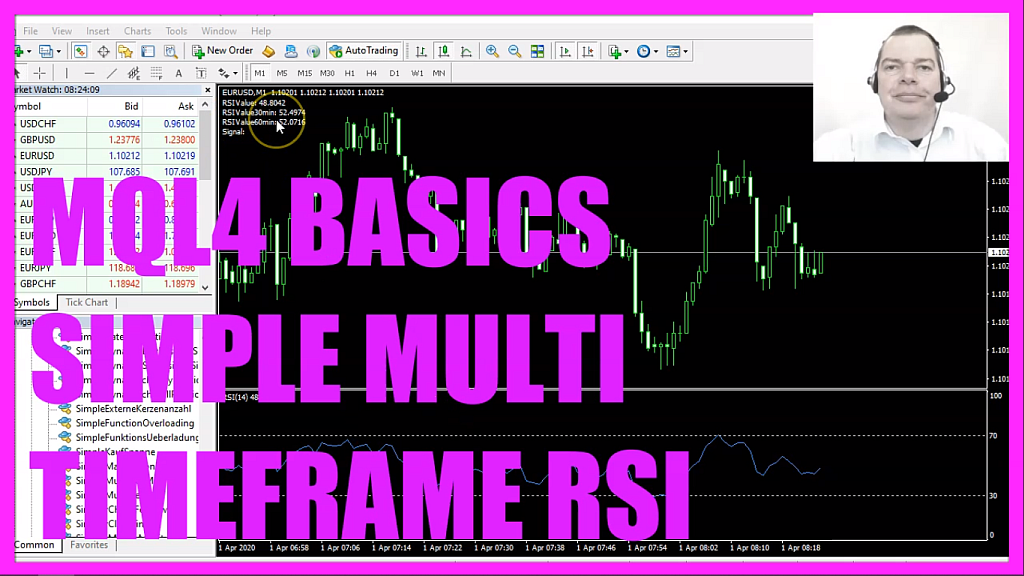
Finally, we want to use the comment statement, this will output the names of the variables and the current signal followed by the calculated values directly on our chart.
This is it! Well, if this was too fast for you or if you don’t understand what all the code here does maybe you want to watch one of the other videos in this basic video series first or maybe even the premium course might be interesting for you, you can find that one on our website.
For now, please click on the compile button or press F7, you shouldn’t get any errors here and if this is the case you can click on a little symbol here or press F4 to go back to Metatrader.
And in Metatrader we use a simple euro-usd one-minute chart window, let’s click on insert, indicators, oscillators, relative strength index, we want fourteen candles, the calculation should be based on the close price, please pick a color here and click on okay and now you should see a separate window containing the RSI and I would like to add the new file that is called simple multiple RSI and drag it on the chart, let’s click on okay.
And here we are! You can see that all the values are calculated because this time we are using a real-time chart, the current value is sixty-five, nine, one, four, eight, that should match the value here.
Now, let’s change the time frame to thirty minutes, the thirty minutes value is fifty-five, seven, one, two, six that matches the value here and if we change to the one-hour time frame we should see that the value for sixty minutes here matches the value for the sixty minutes RSI indicator below, in my case, it works as expected, you might have some problems in the backtest because when you press F2 to open the History Center you maybe don’t see any values for the thirty minutes timeframe here, I only see values for the one-minute time frame, there is a way to convert historical data for the strategy tester but in this little video you have learned how to calculate the RSI value for different time frames and generate buy and sell signals that will open buy and sell positions based on if the RSI value is above seventy or below thirty, and you have coded it yourself with a few lines of mql4 code.

Not sure what to do? Click on the automated trading assistant below

- MQL4 TUTORIAL BASICS - 129 SIMPLE BOLLINGER BANDS…
- MQL4 TUTORIAL - SIMPLE COMMODITY CHANNEL INDEX
- MQL4 TUTORIAL BASICS – 120 SIMPLE RSI BUY STOP
- MQL4 TUTORIAL BASICS - 115 SIMPLE ENVELOPES BUY…
- MQL4 TUTORIAL - SIMPLE CUSTOM TIME FUNCTION
- MQL4 TUTORIAL - SIMPLE MODULAR EXPERT ADVISOR
- MQL4 TUTORIAL - SIMPLE POSITION MULTIPLIER
- MQL4 TUTORIAL BASICS - 126 SIMPLE RUNNING TIMER
